Racial Equity Brief
The Racial Pay Gap
April 2026
By Sarina Phu, Associate Director of Research and Bianca Onwukwue, Fellow
In the District and nationally, structural racism significantly influences how much money a person makes. While the overall gap in pay between women and men—the gender pay gap—has decreased over time, the gap in pay between workers of color and white workers—the racial pay gap—has grown.[1]
HOW WE GOT HERE
According to researcher Stephanie Bornstein, “the racial pay gap has long-standing roots deriving from the legacy of slavery, intentional racial segregation, and hostility to immigrants,” policies which intentionally maintained low wages for Black people, Indigenous people, and people of color in comparison to white people.[2] From 1950 to 1980, the racial pay gap did shrink somewhat because of the introduction of civil rights laws, economic trends, and increased unionization.[3] During that time, wages for low and middle income earners—who were disproportionately workers of color—increased.[4] However, today, the racial pay gaps are much larger than they were prior to 2000. In 2019, the average Black worker earned about 74 cents, and the average Latine worker earned about 75 cents, for every dollar earned by the average white worker.
While there are numerous factors that contribute to the racial pay gap, both individual discrimination (like unconscious bias) and systemic barriers (like occupational segregation, where people of color are concentrated in lower paying jobs) play a role.[5] In addition to discrimination based on race and ethnicity, gender expression, sexuality, and disability further compound the issue.[6] Other systemic factors, like the intentional exclusion of Black people from education[7] and opportunities for advancement[8]—which are also driven by racism—have worsened the racial pay gap over time.[9] As the Center for American Progress reports:
Race-based occupational segregation has its roots in slavery. At the time of emancipation in 1865, approximately two-thirds of enslaved people had been forced to work on farms while others worked in domestic settings. After slavery was abolished, legislation and lack of access to other employment opportunities often left Black workers no choice but to continue working in agricultural or domestic roles; in South Carolina, for example, Black residents could only work as a farmer or a servant unless they received a license from a judge.[10]
In addition, policymakers have deliberately excluded workers of color from labor benefits and protections. For example, the New Deal of 1933-1939, which included protections for workers’ rights to join unions, earn minimum wages, and earn overtime, passed in part because Senate Dixiecrats “conditioned their votes on the exclusion of household workers and field hands [who were predominantly Black workers] so wealthy southerners could continue to benefit from these workers’ cheap labor.”[11]
Policymakers made similar exclusions based on the intersection of gender and race. President Roosevelt deliberately excluded “domestic help” from the New Deal so that Black women specifically would not be covered by the protections.[12] The Social Security Act of 1935 “also directly excluded farmworkers and domestic servants from old-age benefits and unemployment insurance, clearly targeting the African-Americans who filled these jobs.”[13] The Brennan Center explains that
Southern whites were thus able to use New Deal programs to build their prejudices into the law, infusing a large amount of federal spending into efforts to maintain what historian Jacqueline Jones describes as “the fundamental racial and sexual inequalities in the former Confederate states.”[14]
These racist policies laid the foundation for the racial pay gap today.
WHO IS IMPACTED
In 2024, the median family income for a Black District family of four ($60,764) was a fraction of the median family income for a white District family ($168,664).[15] This highlights a difference of about $100,000 in income between Black and white households. There is also an income gap between American Indian and Alaska Native[16] residents (median family income of $66,485), Asian residents ($126,268), Latine[17] residents ($117,634) and white residents.[18]
Gender discrimination exacerbates the racial pay gap: according to the National Partnership for Women & Families, Black women make only 45 cents for every dollar that a white, non-Hispanic man makes in the District.[19] This is despite DC being among the states with the highest median wages for Black women ($53,255).[20]
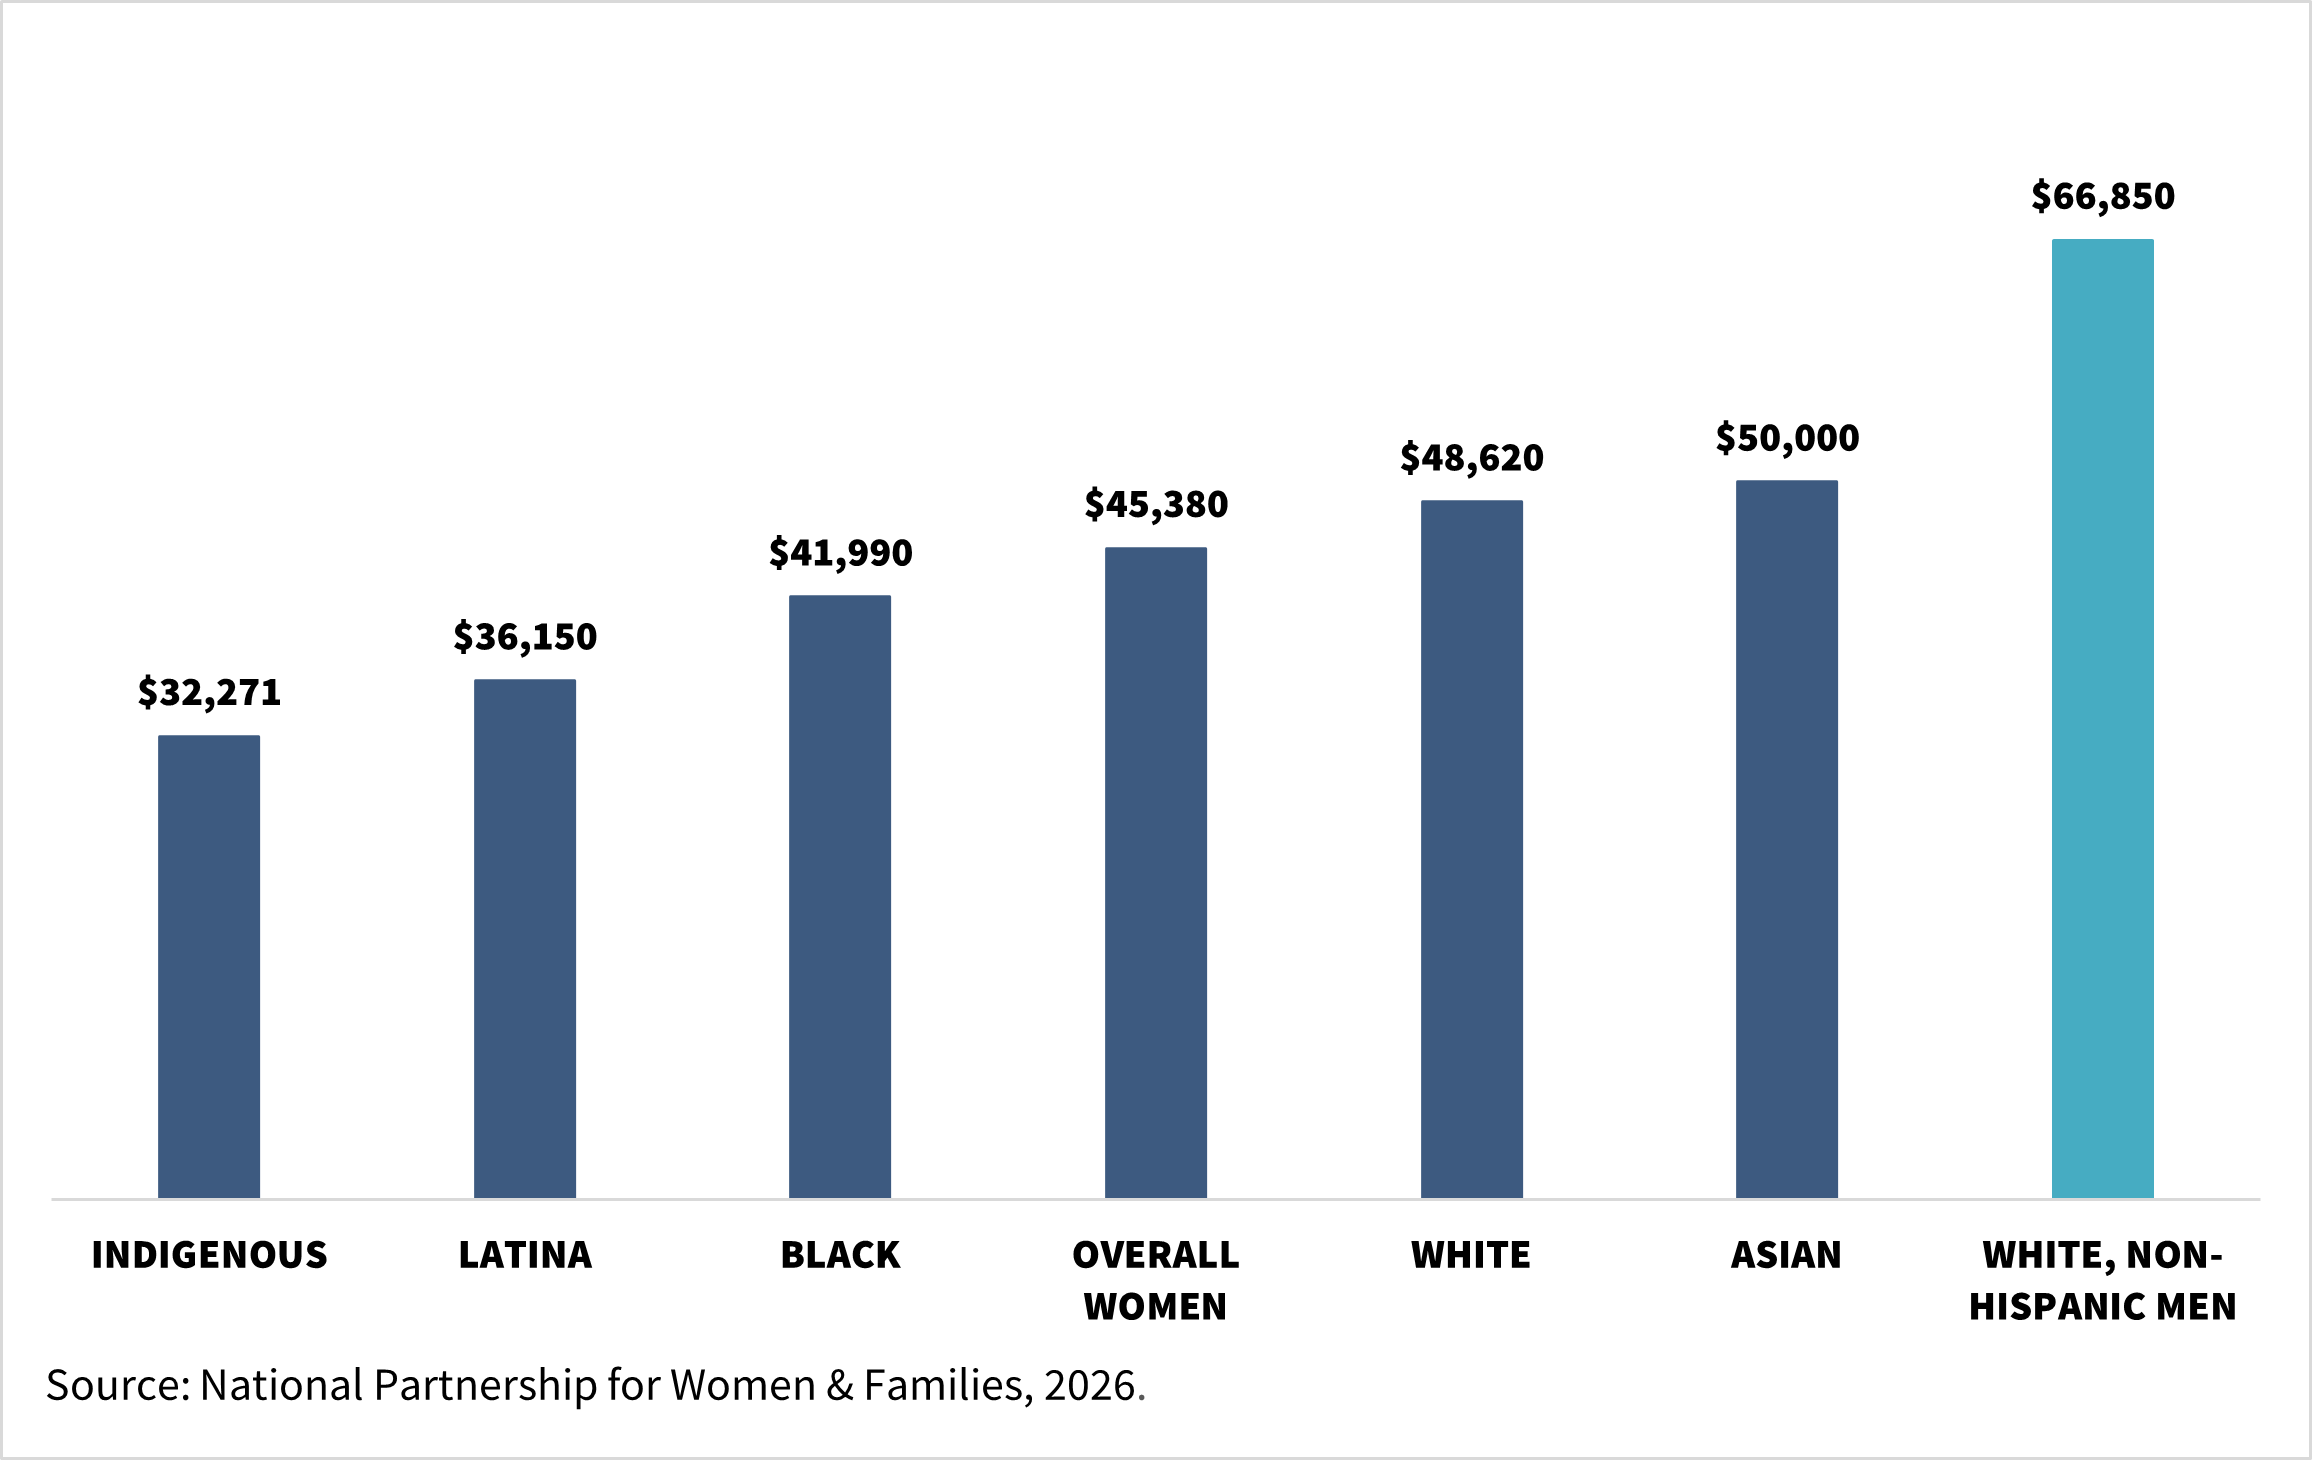
Nationally, Black, Indigenous, and Latine women experience the largest pay gaps when compared to white men (See Figure 1).[21] In 2022, when compared to a white man’s salary, Black women made 70% of that salary, Indigenous women just over 50%, Hispanic women 64%, Asian women 93%,[22] and white women 83%.[23]
This racial pay gap not only affects women of color, but their families too. Notably, women of color are responsible for their families’ livelihood across the country. Nearly 70% of Black women in the US are the “key breadwinners for their families,” meaning their households rely heavily on their wages to survive.[24] Across the US, nearly four million households rely on earnings of Black women, and almost 30% of those households live below the poverty line.[25] Likewise, about 45% of Latina women are key breadwinners for their families, with 27% living below the poverty line.[26] Fifty-six percent of Indigenous women and 43% of Asian and Pacific Islander women are also the key breadwinners in their households.[27],[28]
In addition, 28% of Asian Americans live in multigenerational households (compared to 21% of overall households in the US), which means that their family incomes—and Asian women’s wages—support more people.[29]
A final consideration in relation to race and income is the “Black tax.” Black people who earn moderate or higher incomes in comparison to their family members often experience the phenomenon known as the Black tax, where they assume financial responsibility for relatives and loved ones who earn lower incomes.[30] The Black tax, coupled with the racial wealth gap in the District, exists due to years of systemic racism and policy decisions that robbed Black residents of educational opportunities, homeownership, and wealth building opportunities.
The Black tax described above is a specific phenomenon experienced by Black people, and in the American context, is a direct result of chattel slavery, continued systemic racism, and persistent economic oppression. However, the concern about incomes supporting multiple family members and generations of families applies to Indigenous residents and residents of color in the District as well.
FIGURE 1 Median annual wages are lower for women workers of color than white men nationally.[31]
POLICY CONSIDERATIONS
Over the last few years, the District has taken positive steps toward addressing systemic barriers that maintain the racial pay gap. Notably, the District passed the “Wage Transparency Omnibus Amendment Act of 2023,” which created protections for workers and jobseekers.[32] The bill included provisions that 1) prohibited employers from seeking information on employee wage history, 2) required employers to provide salary ranges and a schedule of benefits to prospective employees, 3) required employers to provide employees with notice of their rights, and 4) granted the Attorney General enforcement powers.[33]
Similarly, several states have implemented policies by passing legislation such as equity pay laws, prohibition of salary history discrimination, salary range transparency laws, among other solutions. This includes states like Colorado, Maryland, Connecticut, Nevada, Rhode Island, New York, Washington, and California.[34] Pay transparency laws require employers to disclose pay or pay ranges in order to allow for complete information within the labor market while shrinking the gender and racial wage gaps. However, there is still little to no empirical research on the effects of these laws on wages, gender and racial wage gaps, and the overall labor market.[35]
California: In 2019, California passed SB 973 that requires data collection and its dissemination by race, gender, ethnicity, job categories, and pay bands for employers of 100 or more employees.[36] These results are published in the California Pay Data Reporting System, and reveals that Black, Latine, and women workers are overrepresented in the lowest salary ranges.[37] The California Equal Pay Act prohibits pay discrimination and includes requirements for pay transparency, wage disclosure, and limits on salary history inquiries. Employers must list pay ranges in job postings and cannot restrict employees from discussing or inquiring about wages. They also cannot use or request an applicant’s salary history when making employment or compensation decisions. A recent amendment mandates that employers report median and mean hourly rates by race, ethnicity, and sex within each job category, in addition to existing demographic breakdowns.[38],[39]
Colorado: Colorado’s Equal Pay for Equal Work Act prohibits employers from paying employees of one sex less than those of another sex for similar work, regardless of job title, when performed under similar conditions. The law includes pay transparency and salary history provisions. Employers must disclose compensation ranges and a general description of benefits in all job postings, including promotional opportunities. They are prohibited from asking about or relying on an applicant’s salary history when determining pay and cannot retaliate against employees who discuss or disclose compensation. Recent amendments expand transparency obligations, requiring employers to announce all job opportunities to current employees and to include details on compensation and career progression opportunities.[40]
Illinois: The Illinois Equal Pay Act prohibits wage discrimination based on sex and race and requires equal pay for employees performing substantially similar work under similar conditions. The law also includes pay transparency and wage disclosure provisions, protecting employees who discuss or compare wages from employer retaliation. Employers must include pay ranges and benefit information in job postings and inform current employees of promotional opportunities. Additionally, employers are prohibited from requesting or relying on an applicant’s salary history in hiring or compensation decisions. Similar to California, Illinois requires employers with 15 or more employees to report pay data and include compensation details in all job listings.[41]
Maryland: Maryland’s pay equity law prohibits employers from paying employees of different sexes, sexual orientations, or gender identities differently for similar work or within the same business. The law also bars employers from providing less favorable employment opportunities based on these characteristics. Maryland includes pay transparency, wage disclosure, and salary history provisions that protect employees who discuss or inquire about wages and require employers to disclose wage ranges and benefits in job postings. Employers may not seek or rely on an applicant’s salary history or take adverse action for refusing to provide it. Maryland’s recent amendments mandates employers to share salary ranges upon request and prohibiting retaliation against applicants who do so. The state also promotes pay data reporting as a tool to detect and address wage disparities by sex, race, and ethnicity, encouraging employers to conduct internal pay audits and ensure equitable compensation practices (effective 2022).[42]
New York: New York’s pay equity law prohibits employers from paying employees in protected classes less than others for equal or similar work performed under similar working conditions. The law also includes wage disclosure, pay transparency, and salary history provisions. Employers cannot restrict employees from discussing or disclosing wages and must include compensation ranges and job descriptions in job, promotion, or transfer postings. Additionally, employers are prohibited from seeking or relying on an applicant’s salary history or retaliating against individuals who decline to provide it.[43]
The racial pay gap exists because of a long history of structural barriers to employment, racially equitable pay, and safety and health in the workplace. However, as the District and other states have shown, policy efforts that address these systems of racial inequity are tangible efforts that can narrow the racial pay gap.
[1] Stephanie Bornstein. “Confronting the Racial Pay Gap.” Vanderbilt Law Review 75, no. 5 (October 20, 2022).
[2] Ibid.
[3] Ibid.
[4] Ibid.
[5] Julia Craven. “The Lived Reality of the Gender and Race Wage Gap.” New America (blog), April 4, 2023.
[6] Rakesh Kochhar. “The Enduring Grip of the Gender Pay Gap.” Pew Research Center, March 1, 2023.
[7] Because of redlining and segregation, students of color are disproportionately overrepresented at schools that are underfunded and under resourced, leading to worse educational outcomes. Better education is linked to better employment and pay outcomes. For more on education and income, see: U.S. Government Accountability Office. “Racial Disparities in Education and the Role of Government,” June 29, 2020, and U.S. Bureau of Labor Statistics. “Education Pays, 2022.” Career Outlook, May 2023.
[8] Research finds that workers of color are less likely to be promoted, more likely to be fired, and less likely to receive positive performance reviews or additional compensation as a result of those positive reviews. In addition, when workers of color have access to promotion opportunities, they have “narrower and less flexible paths to advancement” than white workers. For more on employment, compensation, and reviews, see: Jessica Shakesprere, Batia Katz, and Pamela Loprest. “Racial Equity and Job Quality: Causes Behind Racial Disparities and Possibilities to Address Them.” Job Market and Labor Force. Urban Institute, September 2021.
[9] Stephanie Bornstein. “Confronting the Racial Pay Gap.” Vanderbilt Law Review 75, no. 5 (October 20, 2022).
[10] Marina Zhavoronkova, Rose Khattar, and Matthew Brady. “Occupational Segregation in America.” Center for American Progress, March 29, 2022.
[11] Caroline Fredrickson. “How Labor Laws Disfavor People of Color.” Brennan Center for Justice, June 29, 2020.
[12] Ibid.
[13] Ibid.
[14] Ibid.
[15] U.S. Census Bureau. “Median Income in the Past 12 Months (in 2024 Inflation-Adjusted Dollars).” American Community Survey, ACS 5-Year Estimates Subject Tables, Table S1903. Accessed April 2026.
[16] We use the term “American Indian and Alaska Native” to stay true to the source. We have opted to use the term “Indigenous” throughout this brief when not quoting a specific source. For more on the term “Indigenous,” please see Merriam-Webster.
[17] Although the data cited throughout this brief uses the term "Hispanic or Latino origin," CORE is using the term "Latine." Sources often use the term “Hispanic” because they rely on Census or other federal data which use the term “Hispanic” to collect data on people with ethnicities related to Spanish-speaking countries in Latin America and Spain. However, most “Hispanics” in the United States and the District are people with ethnicities from Latin America (also known as Latine)—and not Spain. The term “Hispanic” does not fully acknowledge the unique history of oppression and colonialism that Latines have faced in the United States and the District. To recognize this history, CORE uses the term "Latine" instead of "Hispanic." For more on this topic, see Mark Lopez, Jens Manuel Krogstad Hugo, and Jeffrey S. Passel. “Who Is Hispanic?” Pew Research Center.
[18] U.S. Census Bureau. “Median Income in the Past 12 Months (in 2024 Inflation-Adjusted Dollars).” American Community Survey, ACS 5-Year Estimates Subject Tables, Table S1903. Accessed April 2026.
[19] National Partnership for Women & Families. “Black Women and the Wage Gap: Fact Sheet,” October 2022.
[20] Ibid.
[21] Elise Gould and Katherine deCourcy. “State of Working America Wages 2022.” Economic Policy Institute, March 23, 2023.
[22] It is important to note that “Asian” encompasses a broad, diverse range of ethnic groups with a large ethnic disparity in income. For example, when disaggregated by ethnicity, data shows that Malaysian, Taiwanese, and Indian women were the highest earners—at about 121 cents for every dollar earned by white men. In comparison, the lowest wages for Asian women were for Burmese women (52 cents per dollar earned by white men), Nepali women (54 cents), and Tongan, Cambodian, Hmong, and Samoan women (60 cents). See National Partnership for Women & Families. “Asian American, Native Hawaiian and Pacific Islander Women and the Wage Gap: Fact Sheet,” March 2023.
[23] Elise Gould and Katherine deCourcy. “State of Working America Wages 2022.” Economic Policy Institute, March 23, 2023.
[24] National Partnership for Women & Families. Black Women and the Wage Gap. Fact Sheet. 2025.
[25] Ibid.
[26] National Partnership for Women & Families. Latina Women and the Wage Gap. Fact Sheet. 2025.
[27] National Partnership for Women & Families and Return to the Heart Foundation. Native American Women and the Wage Gap. Fact Sheet. 2025.
[28] National Partnership for Women & Families. “America’s Women and the Wage Gap,” March 2023.
[29] National Partnership for Women & Families and National Asian Pacific American Women’s Forum. Asian American, Native Hawaiian and Pacific Islander Women and the Wage Gap. Fact Sheet. 2026.
[30] For more on the Black tax and the racial wealth gap, see: Barbara Robels, Betsy Leondar-Wright, and Meizhu Lui. The Color of Wealth: The Story Behind the US Racial Wealth Divide. The New Press, 2006.; Mehrsa Baradaran. The Color of Money: Black Banks and the Racial Wealth Gap. Harvard University Press, 2017.; and Kijakazi, Kilolo, Darrick Hamilton, Rachel Marie Brooks Atkins, Mark Paul, William A. Darity Jr., and Anne E. Price. “The Color of Wealth in the Nation’s Capital,” November 2016.
[31] Tori Coan and Jessica Mason. The Wage Gap #IRL (In Real Life) for Women of Color: Groceries, Child Care and Student Loans. Fact Sheet. National Partnership for Women & Families, 2026.
[32] See CORE’s Racial Equity Impact Assessment on Bill 25-0194, the “Wage Transparency Omnibus Amendment Act of 2023.”
[33]For further discussion on the racial pay gap, see CORE’s Racial Equity Impact Assessments on Bill 25-0026, (on pay range visibility), Bill 25-0140, (on fair wages), Bill 25-0194, (on pay scale and benefits disclosure), Bill 25-0744 (on youth wages).
[34] Becca Damante, Lauren Hoffman, and Rose Khattar. “Quick Facts About State Salary Range Transparency Laws.” Center for American Progress, March 9, 2023.
[35] National Women’s Law Center. “Progress in the States for Equal Pay.” October 2023.
[36]CHAPTER 10. Annual Pay Data Report [12999- 12999.], California Government Code. Accessed April 2026.
[37] California Pay Data Reporting System. “Pay and Demographics of California Workers: Results from Annual Pay Data Reports.” 2026.
[38]SB-1162 Employment: Salaries and Wages. (2022).
[39]SB-1162 Employment: Salaries and Wages. (2022).
[40]Equal Pay for Equal Work Act, Senate Bill 19-085. Accessed April 2026.
[41] Annette Tyman. “New Pay Transparency Requirements for Illinois Employers On the Horizon for 2025.” New Pay Transparency Requirements for Illinois Employers On the Horizon for 2025, September 4, 2024.
[42]Labor and Employment - Wage History and Wage Range, Maryland House Bill 123 (2020).